Country: Romania
I tried the Electricity Price Trend feature and I think this is a very useful direction for the Aqara Home app.
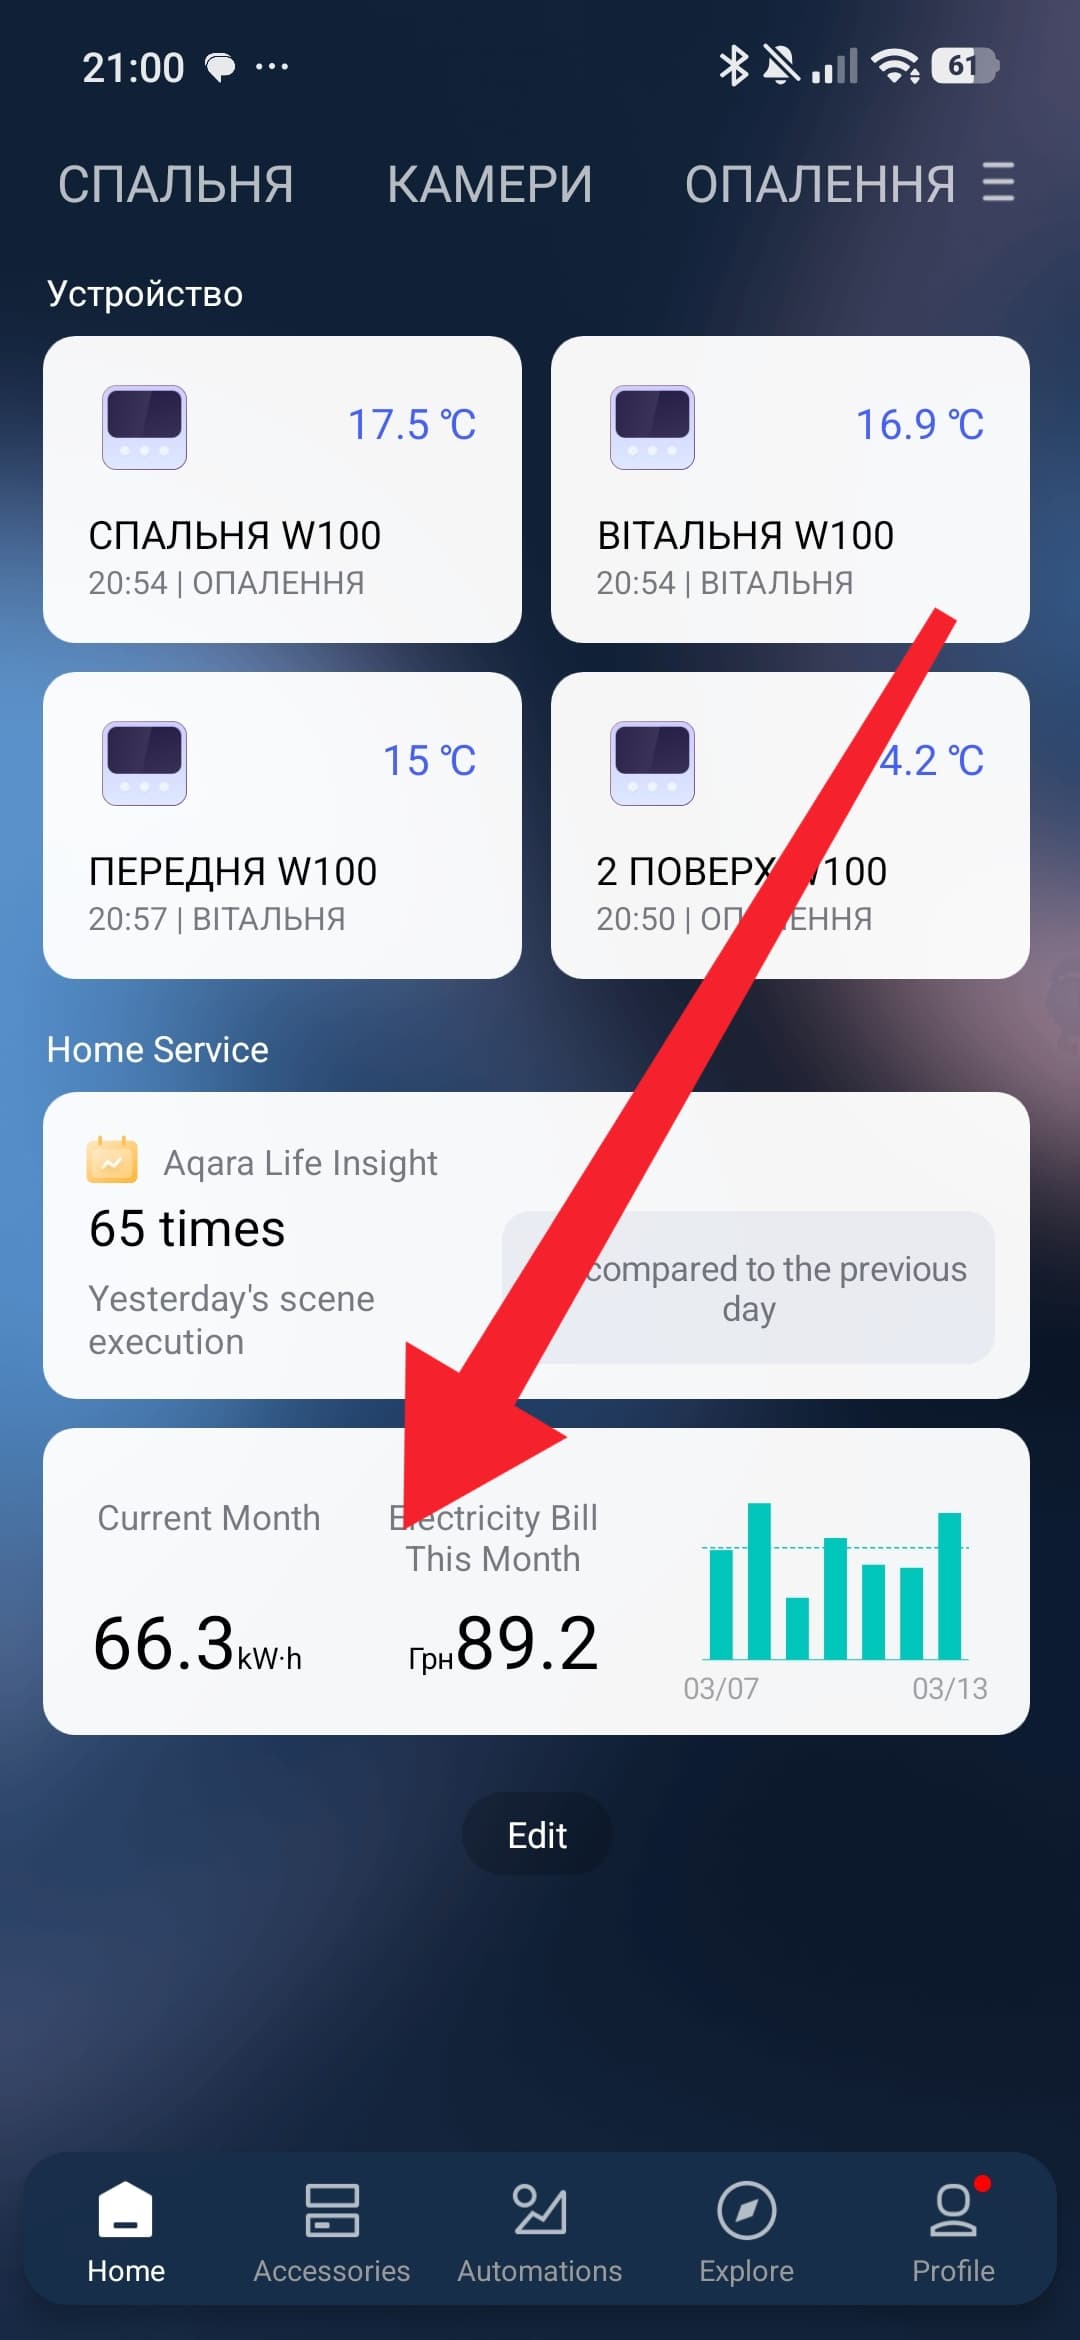
For Romania, the trend view looks helpful as a planning tool for shifting usage of higher-consumption devices to better hours the next day. I like that it focuses on the trend instead of overwhelming the user with too much data, and the chart is easy enough to understand once the feature is enabled. Based on the forum post and Aqara’s clarification, I understand this is a next-day qualitative forecast, not exact hourly pricing, and I think that approach still has a lot of practical value.
What I like
- it gives a quick overview of when electricity is likely to be cheaper or more expensive
- it can help with planning appliances like washing machine, dishwasher, water heater, or EV charging
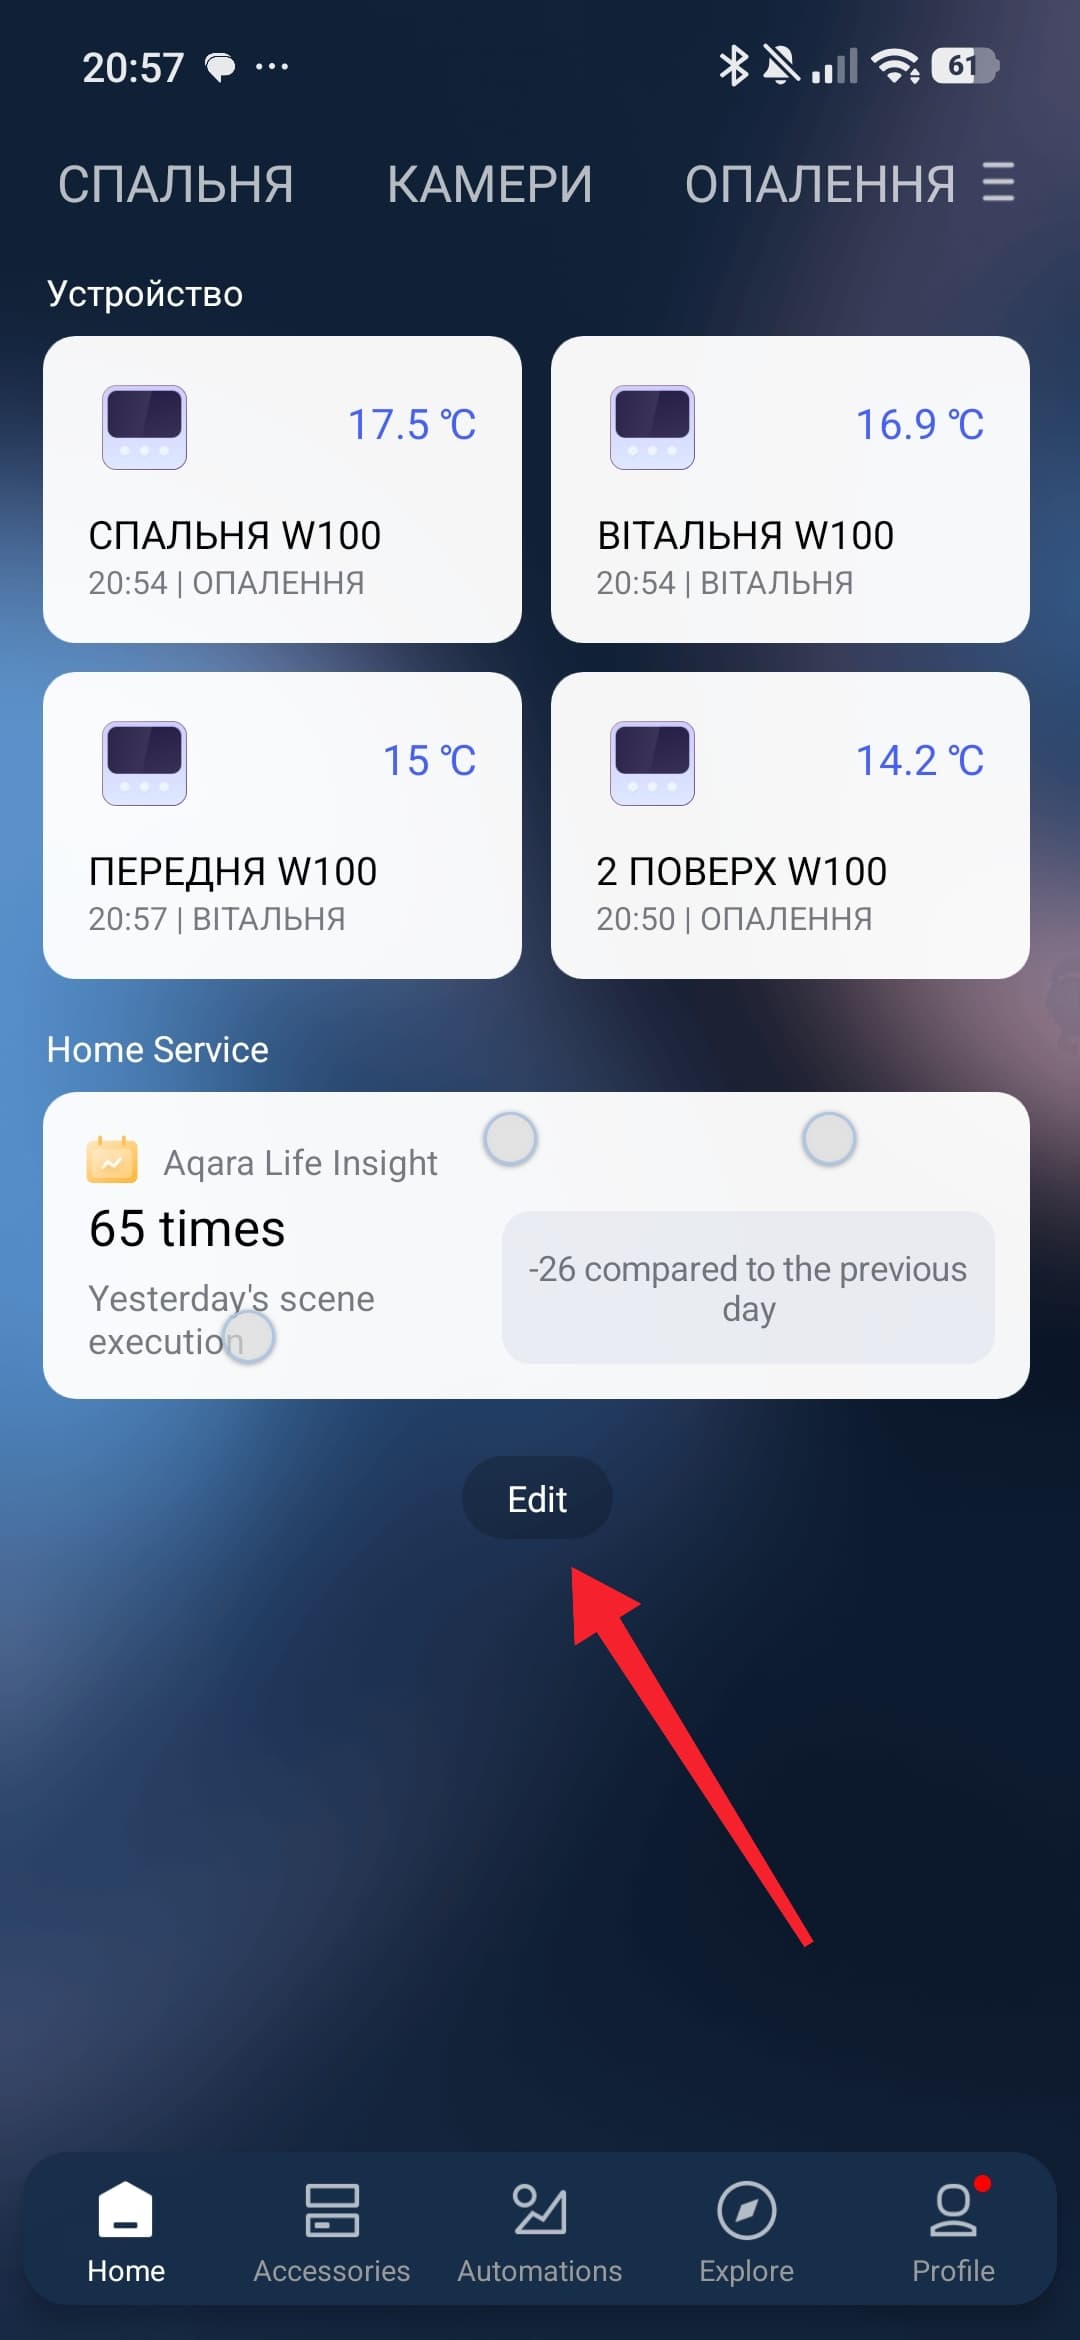
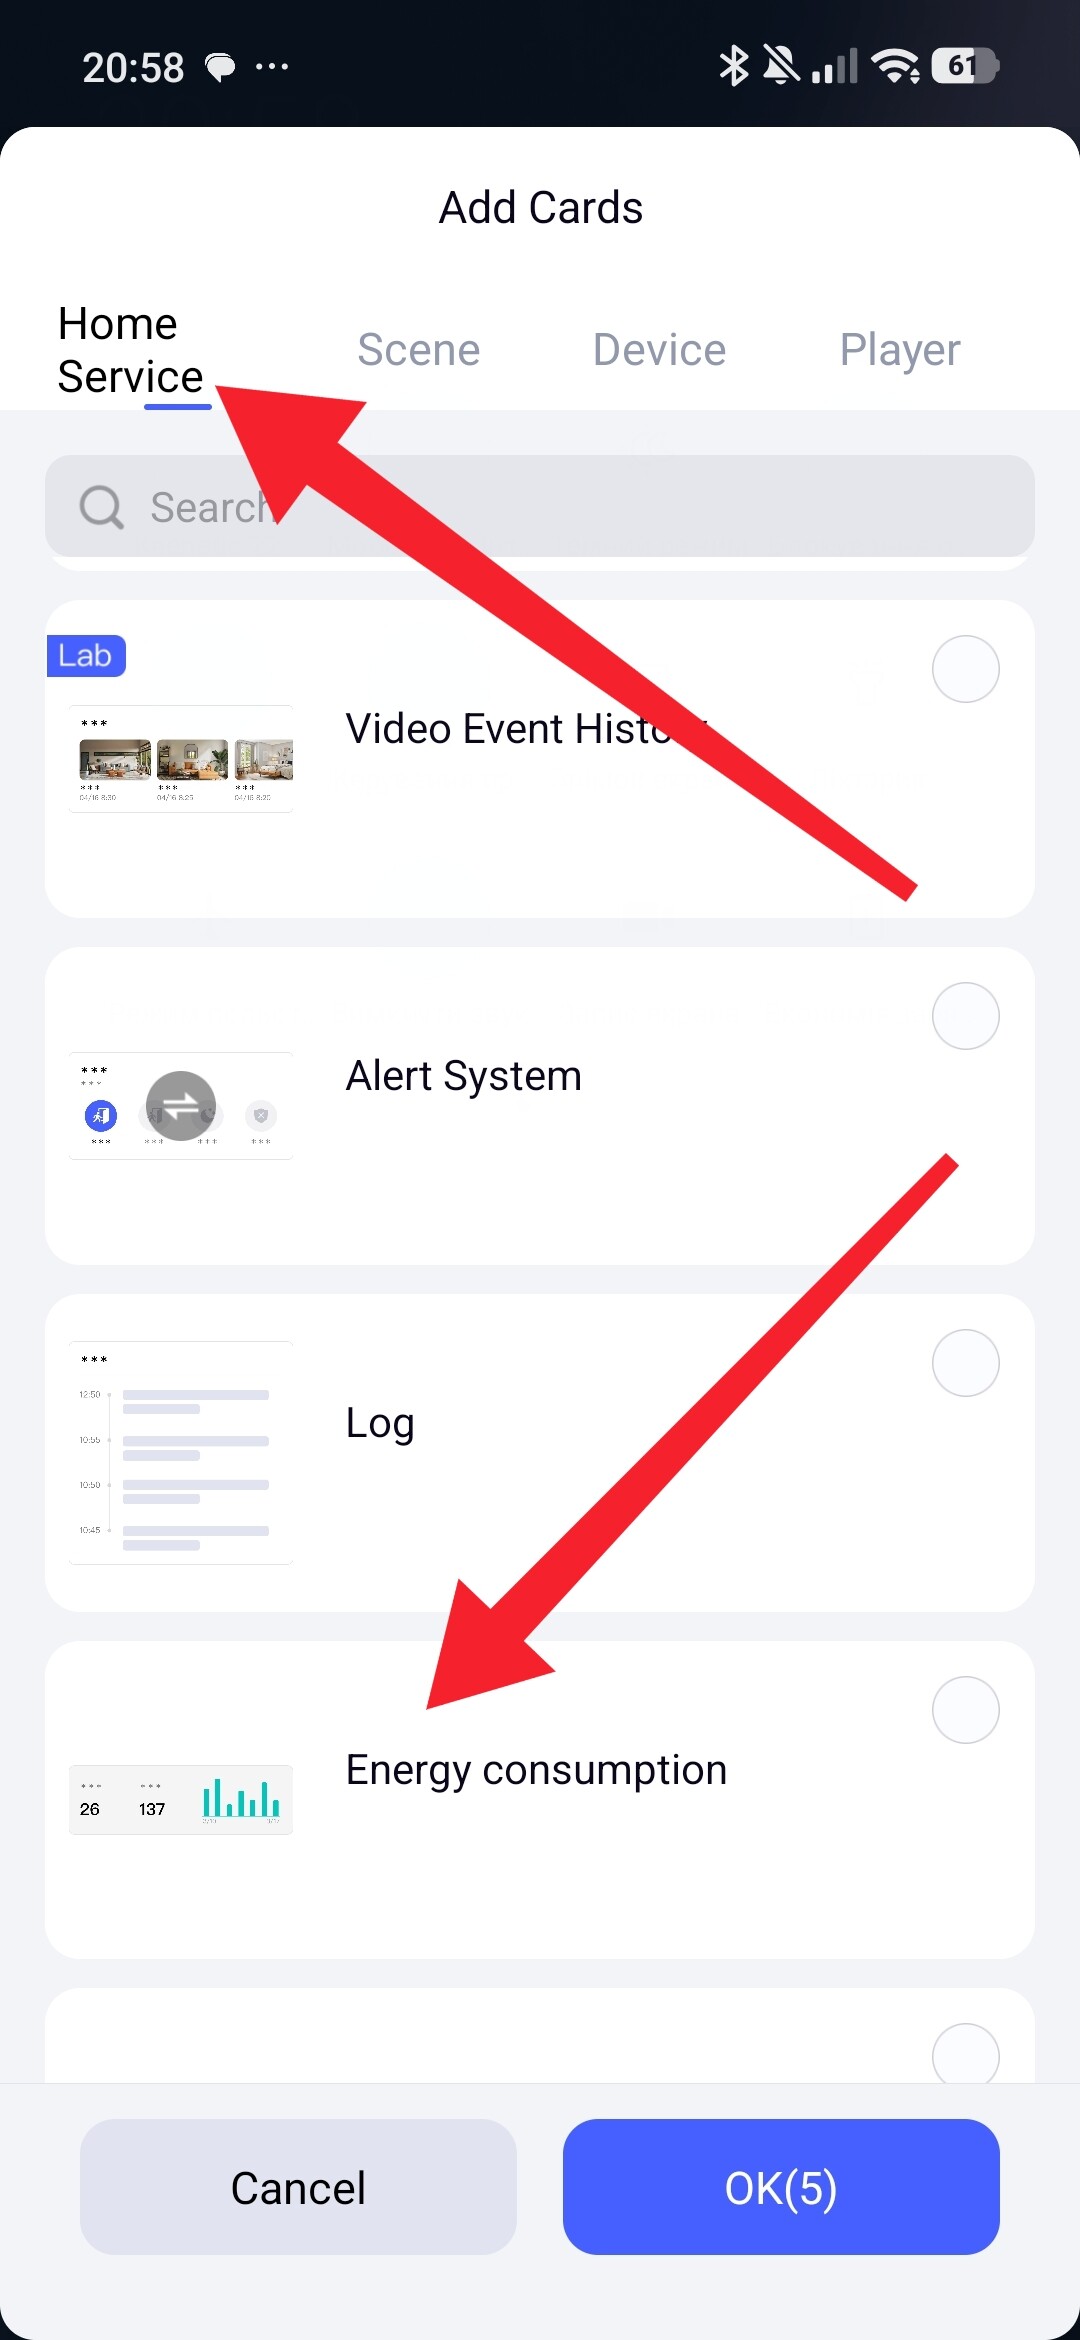
- it fits very well inside the Energy Consumption service
What could be improved
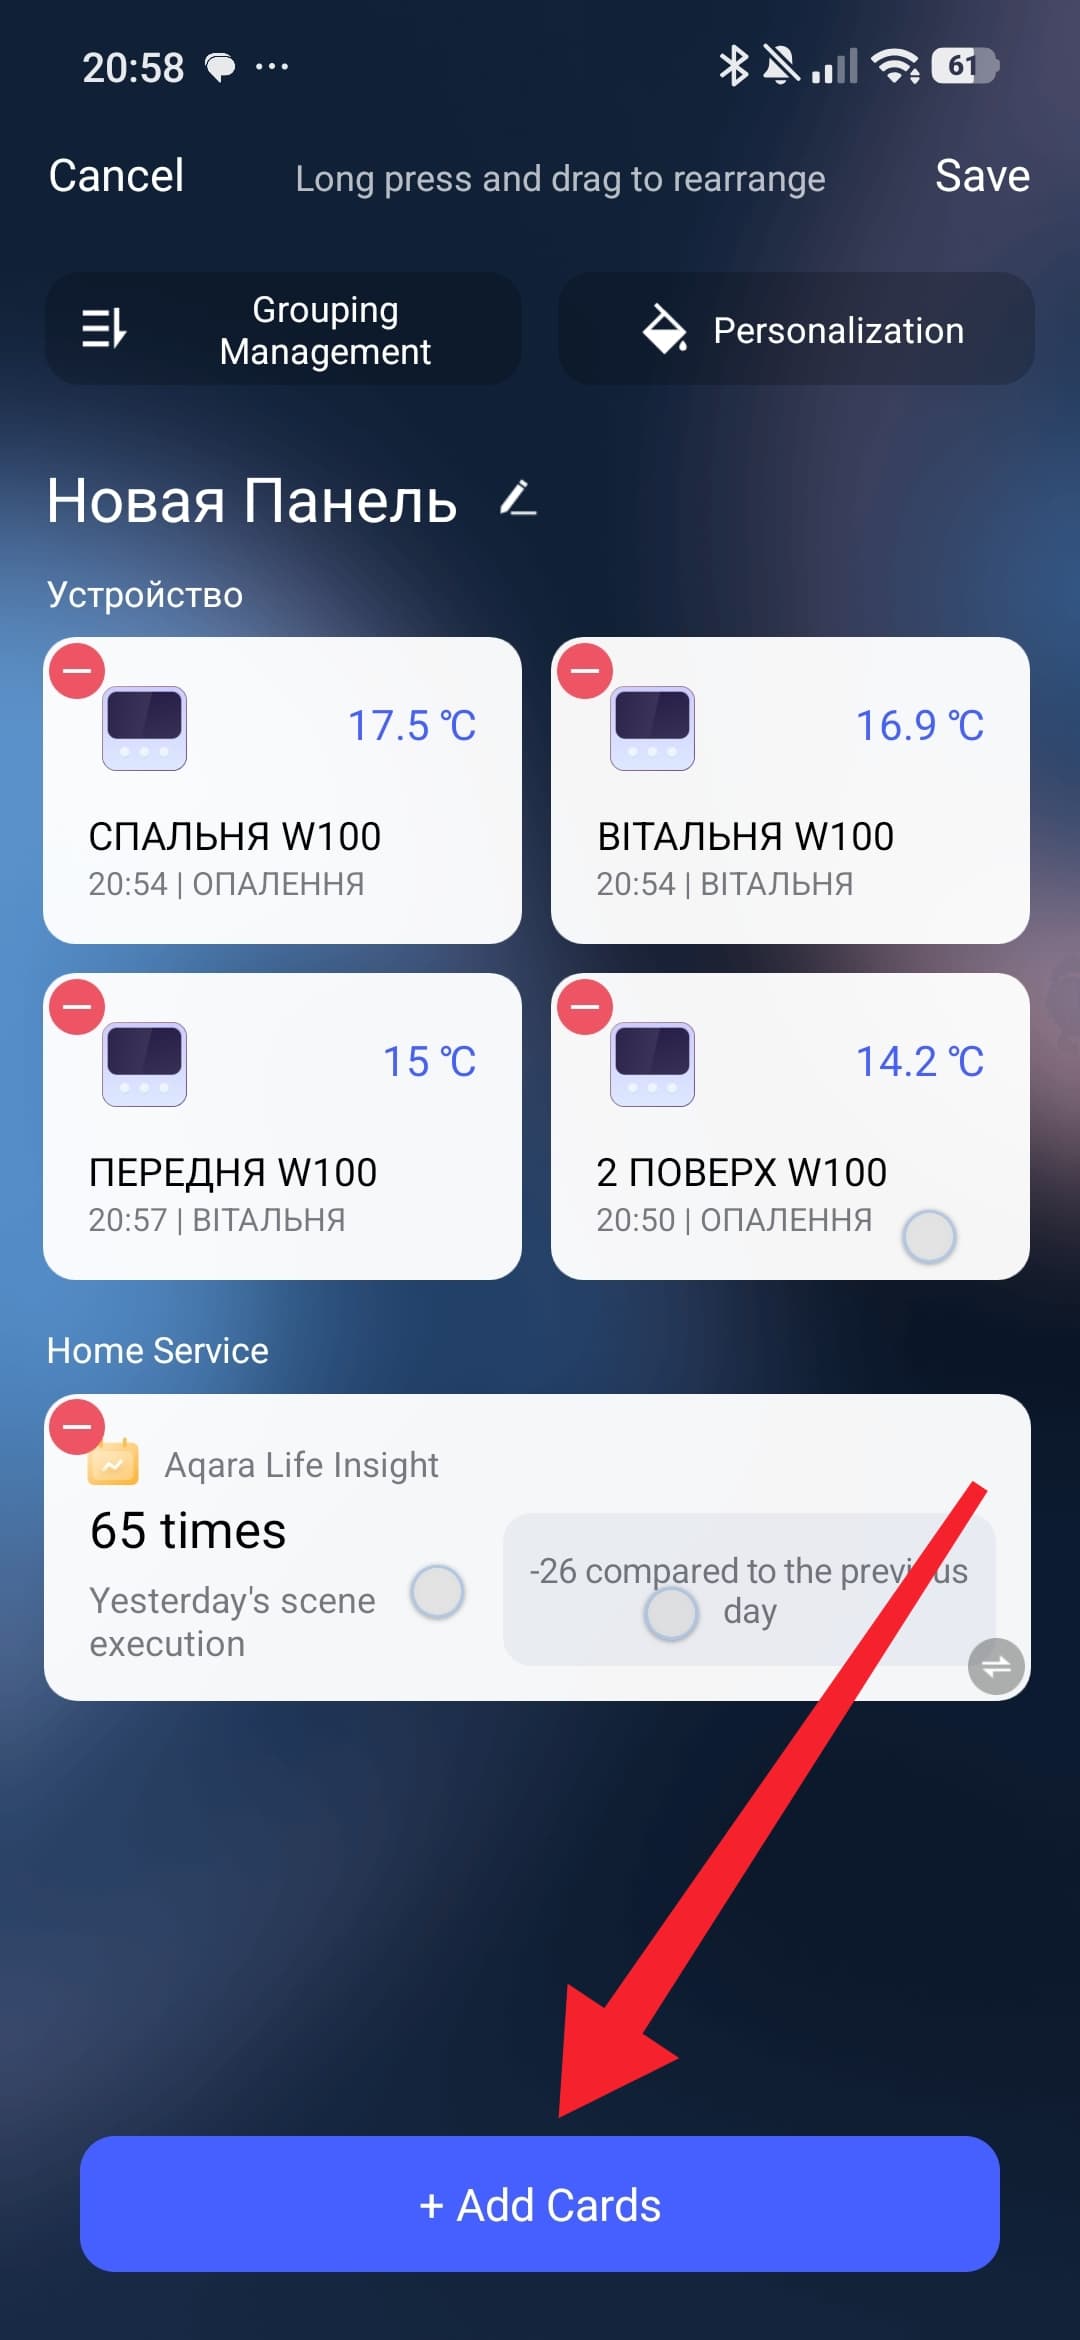
- the feature could be easier to discover in the app, especially for users who do not explore the Energy Consumption section often
- the chart could highlight the best hours and worst hours more clearly at a glance
- a short label like low / medium / high trend on the graph would make it even more intuitive
What I’d love to see next
- automation support, so devices can react to lower-price periods automatically
- notifications when a cheaper period is coming
- integration with smart plugs or energy scenes
- solar / battery / EV charging logic in the future
- a way to compare the forecasted trend with actual usage behavior over time
For me, the biggest next step would be turning this from a useful chart into a feature that can directly drive smart automations.
Overall, this is a promising addition to the app, and I’d really like to see Aqara continue developing it in the direction of energy optimization + automation.